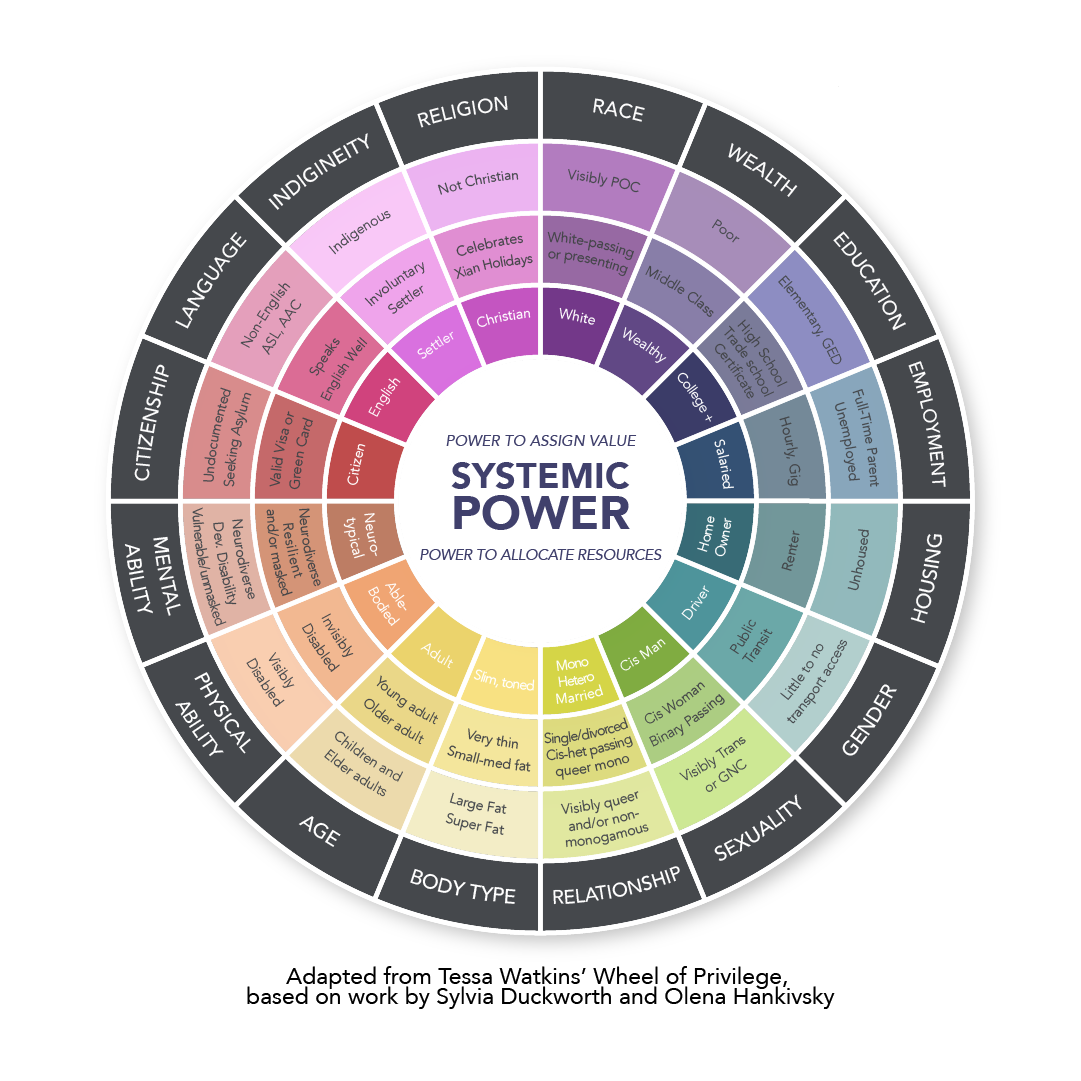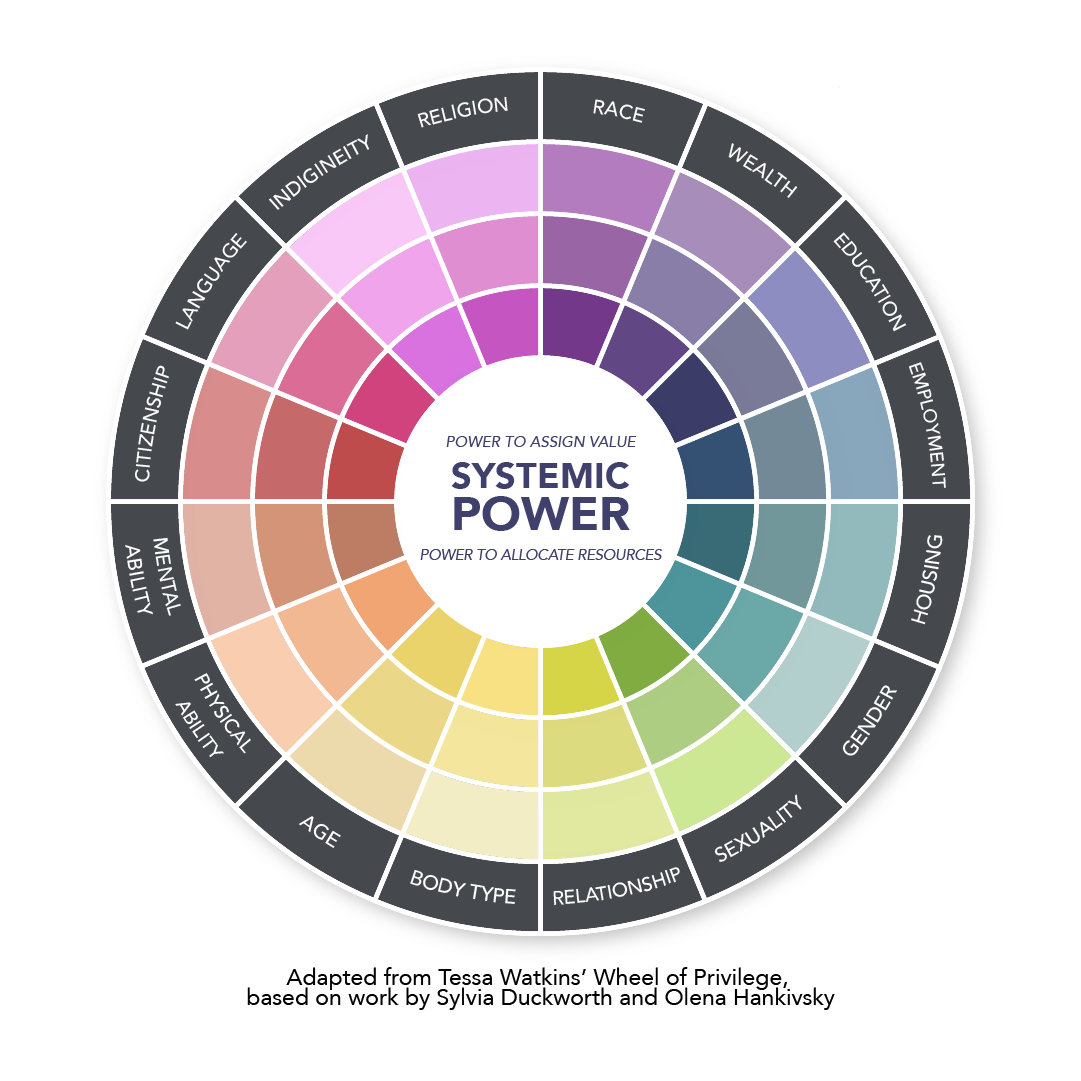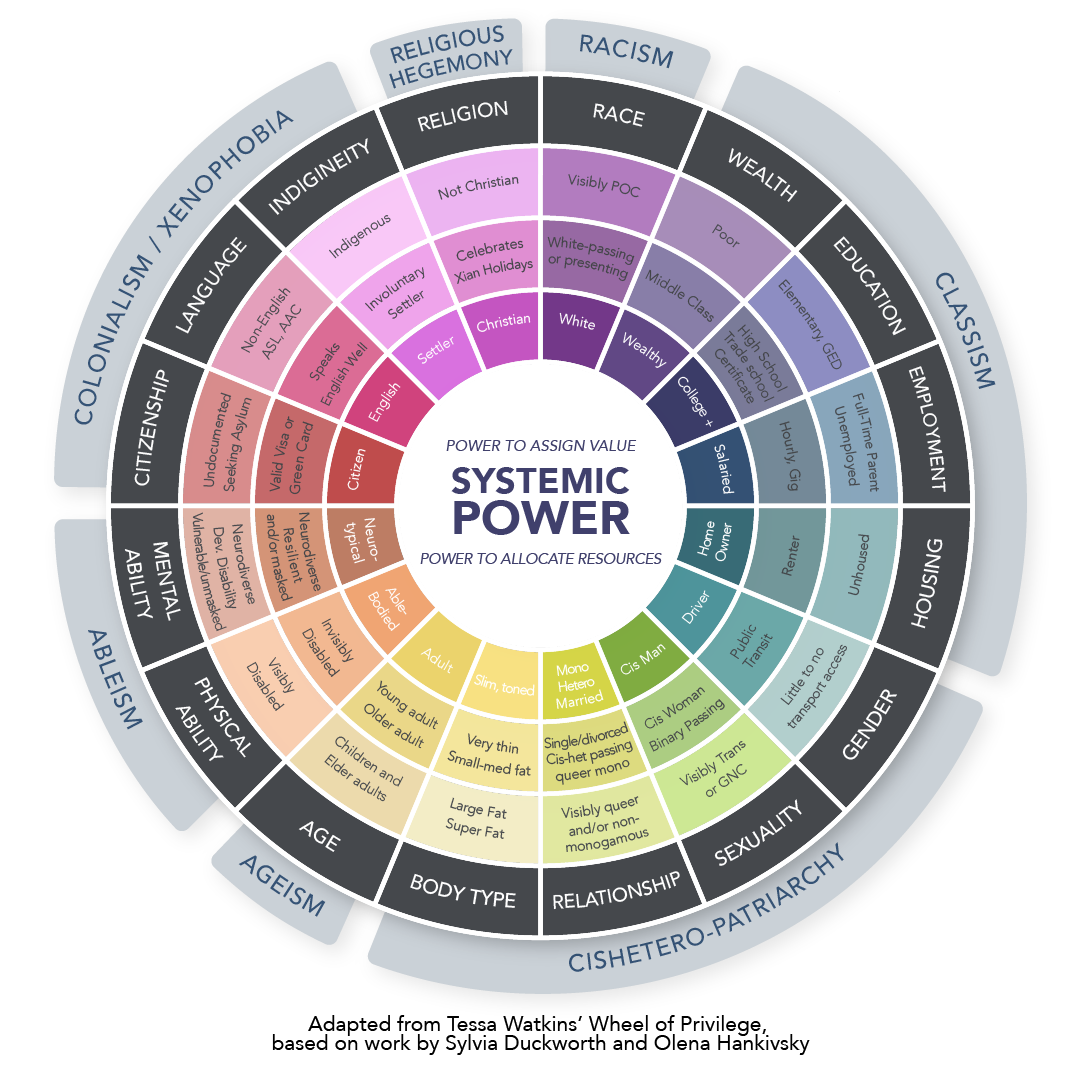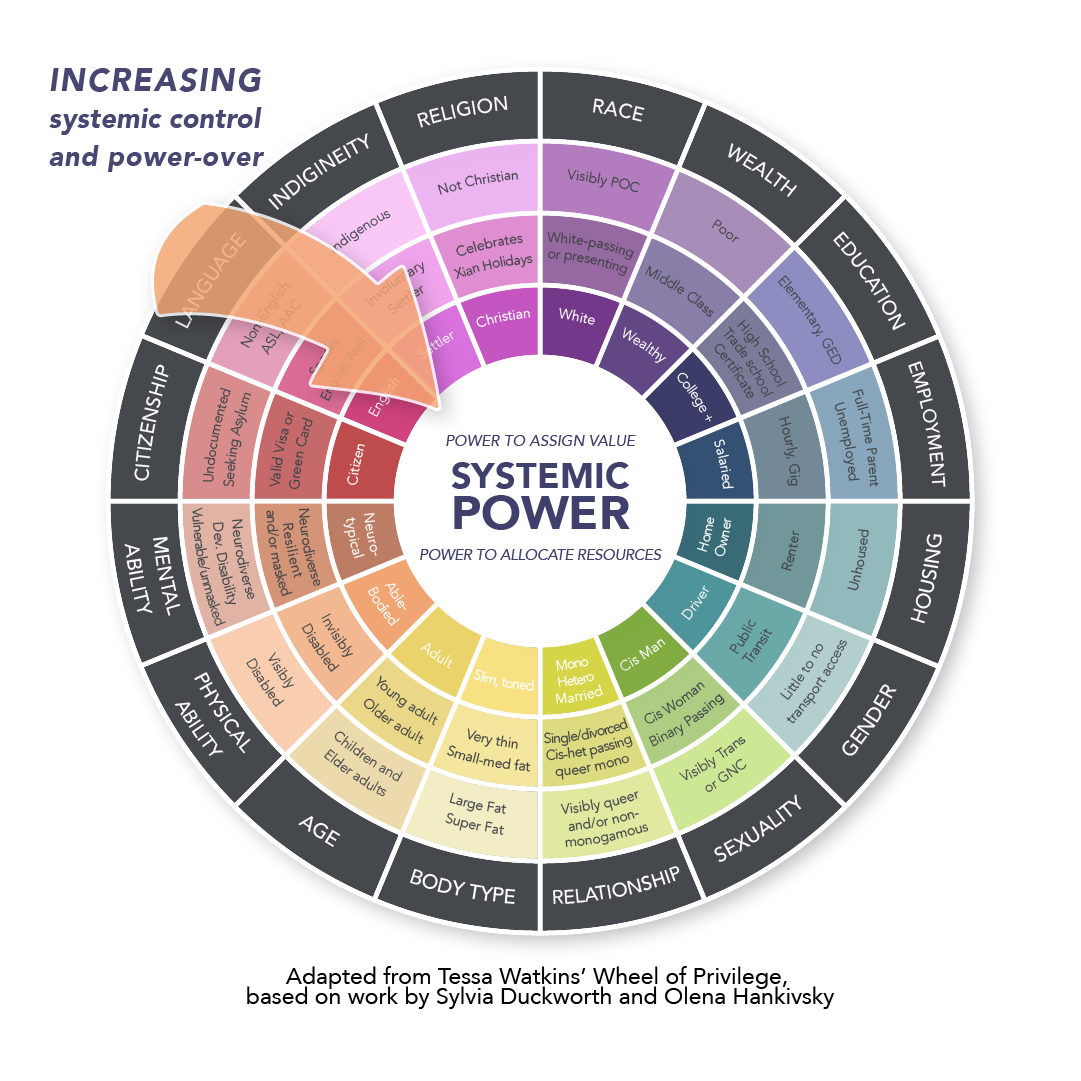
Social Location Wheel
This infographic was developed for Interhelp Partners, as a tool for illustrating social hierarchies and power dynamics within a racial justice training framework. The client asked for a few different versions of the Social Location wheel so that they could walk participants through both an explanation of examining social and systemic power and a group practice of filling out the wheel for themselves.
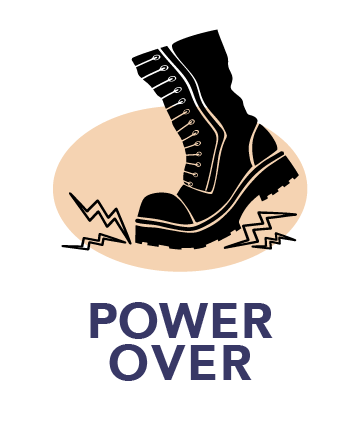
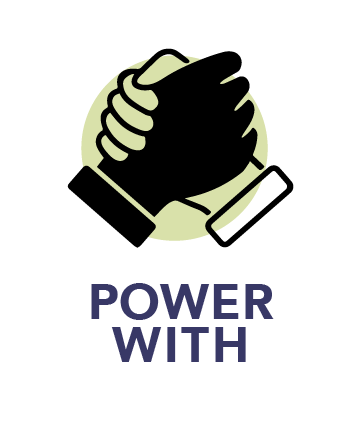
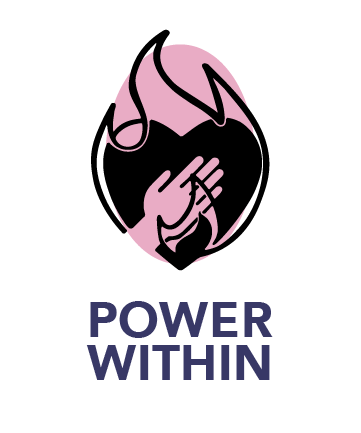
I also developed a few icons for use in their class slideshow, in order to illustrate various types of power (both positive and negative) that they could discuss with their classes as they think through what kind of power each participant has access to.
As with all infographics, this project presented the challenge of condensing a lot of information into a readable format. The client wanted each “square” to be distinguishable as well, so I spent quite some time tweaking color values to be readable yet distinguishable between each other. A print version was also produced with further color adjustments to account a CMYK color space, and for darker tones that often come from physical printing.